Hedera (HBAR) price is up 11% in the last 24 hours, with its market cap reclaiming the $13 billion threshold and trading volume surging by 78% to $745 million. Technical indicators suggest that HBAR is in the early stages of a potential uptrend, as its ADX has risen to 13.97, signaling improving momentum.
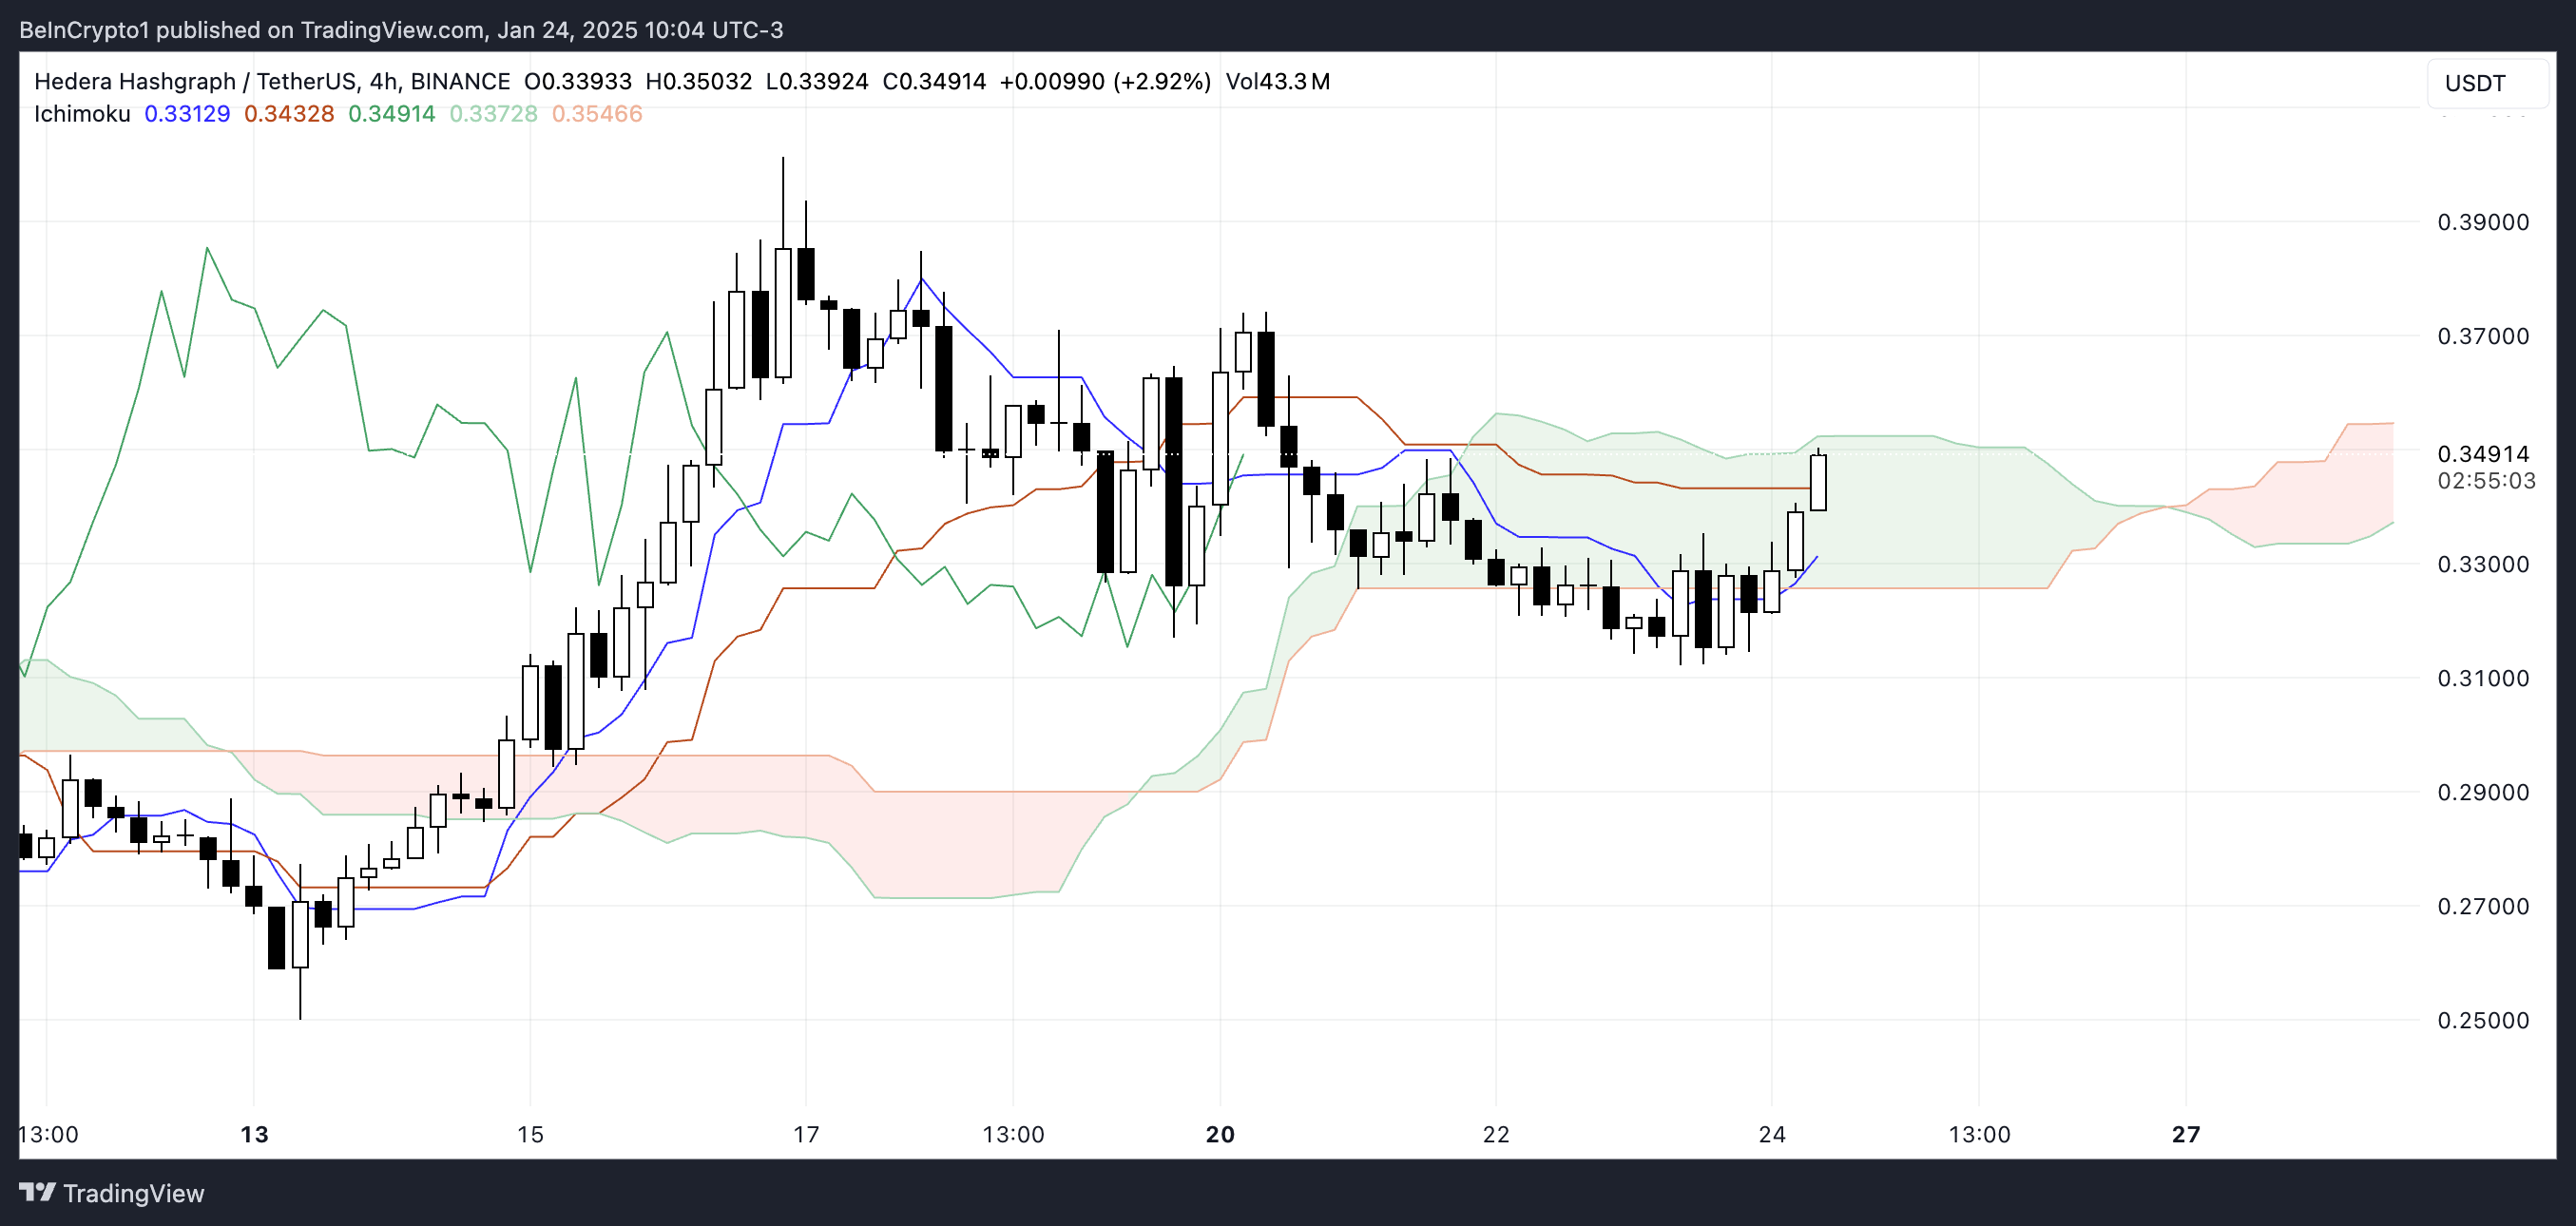
The Ichimoku Cloud chart supports this bullish outlook, with a breakout above the cloud and upward-trending Tenkan-sen and Kijun-sen lines. If HBAR breaks the resistance at $0.374, it could rally toward $0.40, though a reversal may test key supports at $0.31 and $0.296.
HBAR ADX Indicates Current Trend Lacks Strength
Hedera ADX (Average Directional Index) currently stands at 13.97, up from 12.7 yesterday, signaling a potential shift from a downtrend to an emerging uptrend.
The ADX is a technical indicator used to measure the strength of a trend, regardless of its direction. Values below 20 indicate a weak or nonexistent trend, while values above 25 suggest a strong trend. Increasing values confirm the trend’s growing strength.
At 13.97, HBAR ADX remains below the 20 threshold, indicating that the new uptrend is still in its early stages and lacks significant strength.
However, the rise from yesterday’s low suggests that momentum is beginning to build. If the ADX continues to climb, it could confirm the development of a stronger uptrend, potentially driving further price gains for HBAR.
Hedera Ichimoku Cloud Shows A Bullish Setup
The Ichimoku Cloud chart for HBAR shows a bullish breakout above the cloud, indicating that the price has moved into a more favorable zone.
The green cloud ahead (Senkou Span A above Senkou Span B) suggests potential support in case of a retracement, while the Tenkan-sen (blue line) and Kijun-sen (red line) are trending upward, signaling short-term momentum aligning with broader bullish sentiment.

With HBAR price clearing the cloud and both leading indicators showing bullish alignment, Hedera appears poised to sustain its uptrend.
However, if the price reverses and dips back into the cloud, it could indicate consolidation or weakening momentum. The green cloud below could act as support, keeping the broader bullish structure intact.
HBAR Price Prediction: Potential 14% Increase
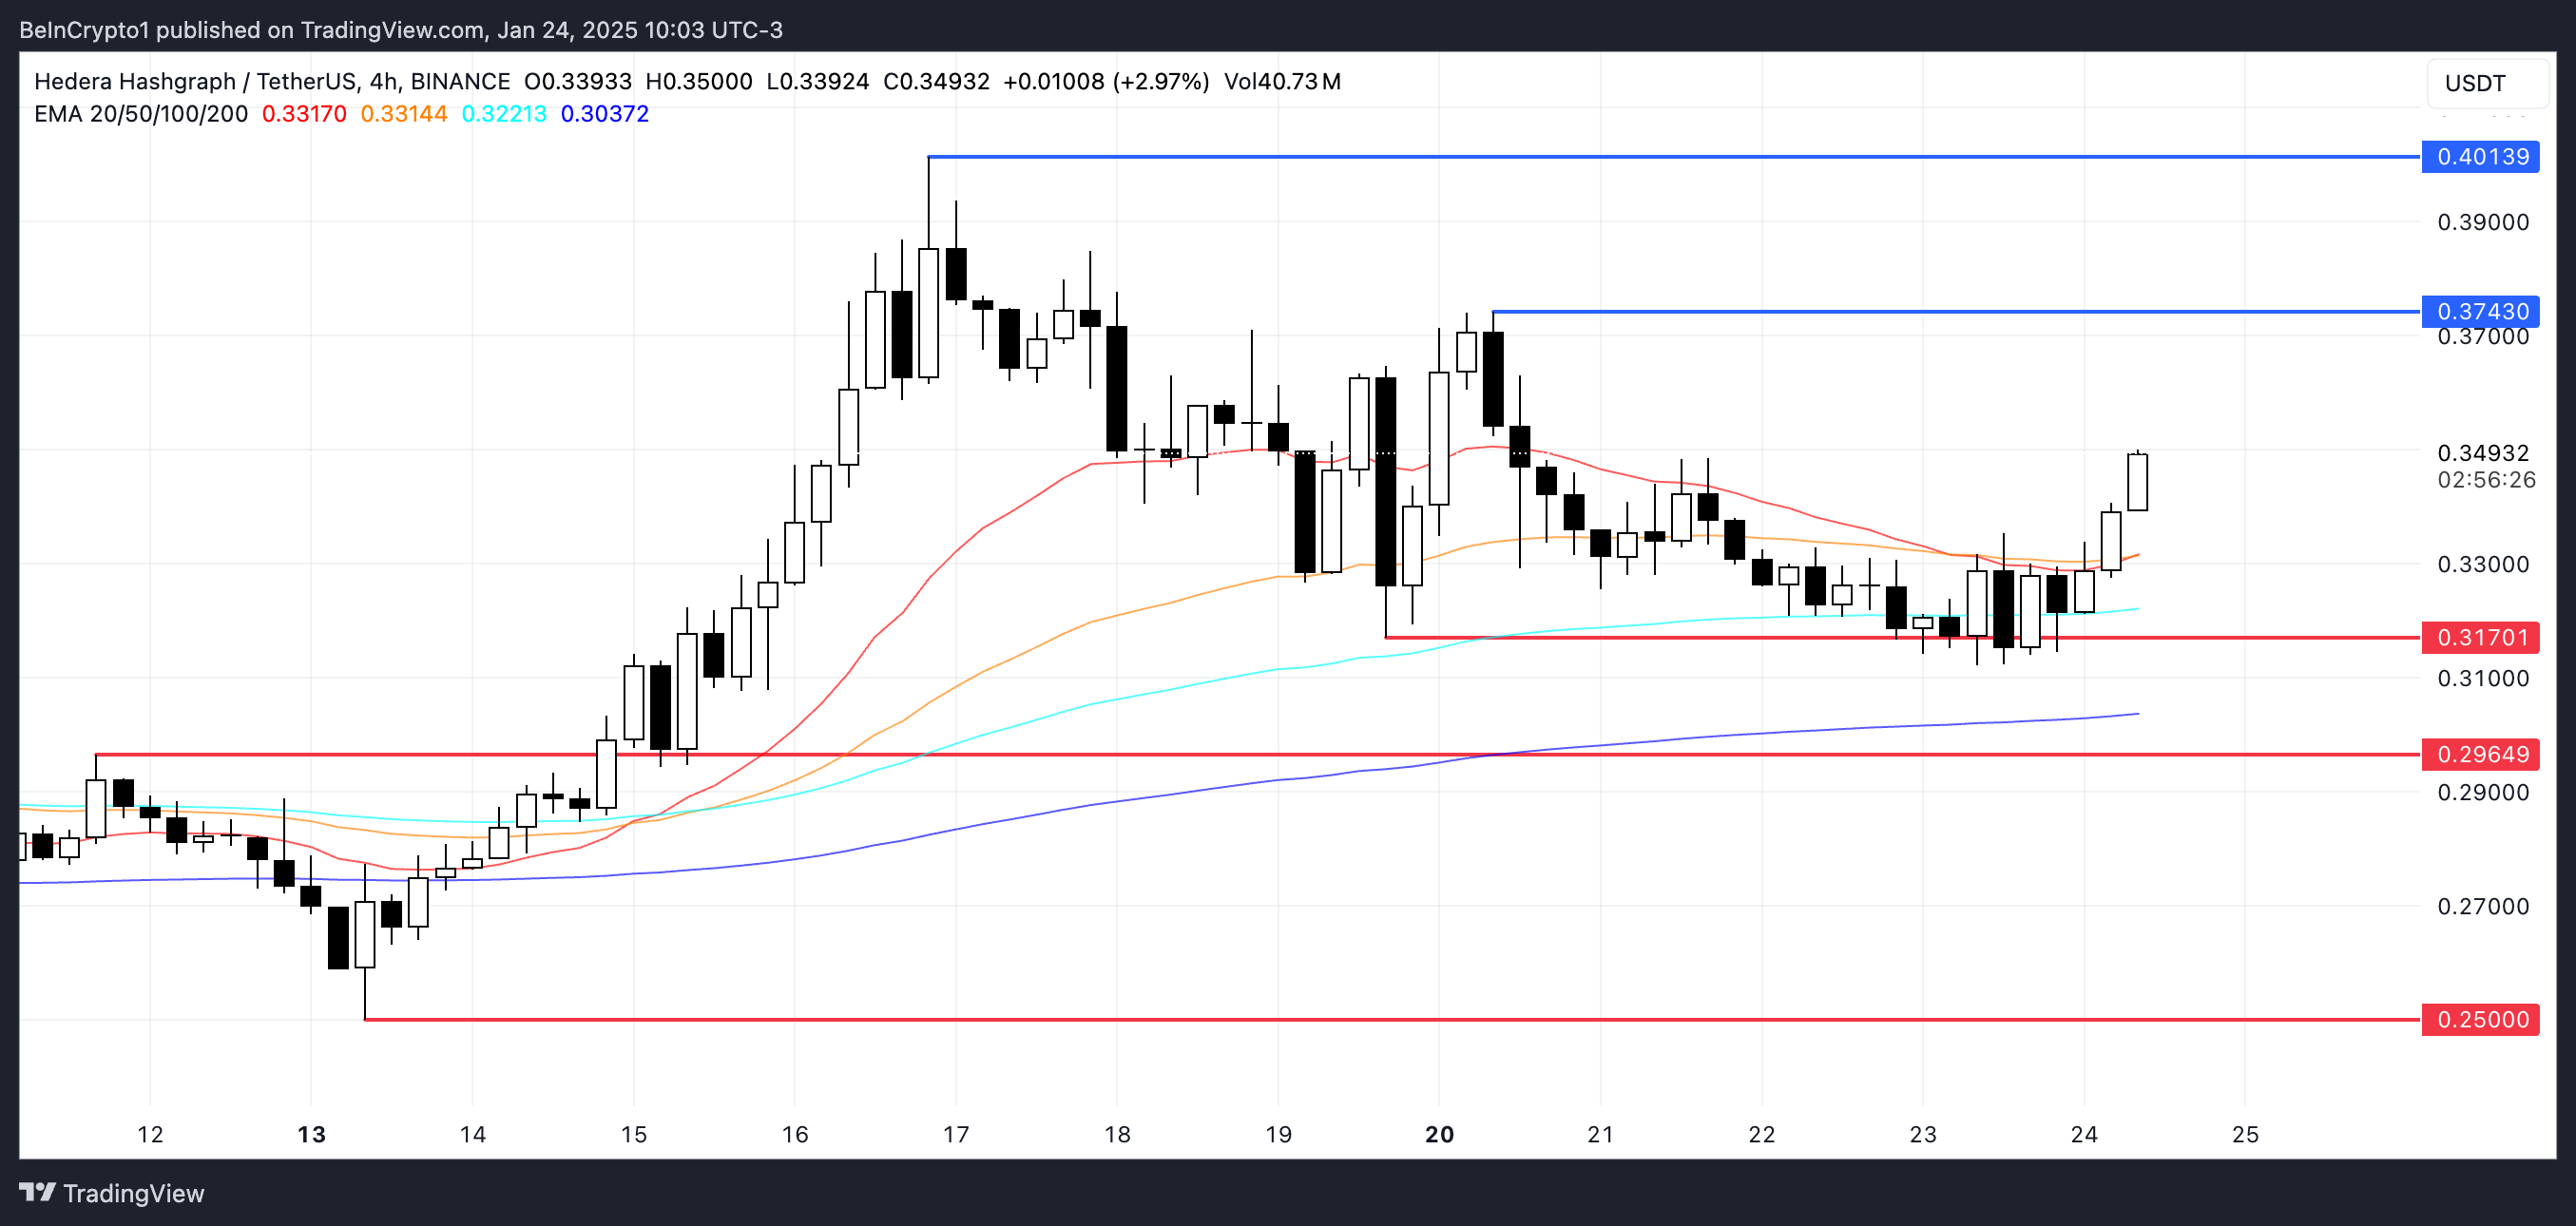
HBAR’s next significant resistance is near $0.374, with EMA lines suggesting that a golden cross could soon form. This bullish crossover, if confirmed, could ignite a strong upward move, potentially breaking the resistance at $0.374 and pushing Hedera price toward $0.40.
Such a move would represent a 14.2% upside, signaling renewed strength in the ongoing uptrend.

Conversely, if the current trend reverses, the immediate support at $0.31 could come into play. A breakdown below this level may lead to further declines, with the next support at $0.296 and a potential drop to $0.25 if that fails.
Disclaimer
In line with the Trust Project guidelines, this price analysis article is for informational purposes only and should not be considered financial or investment advice. BeInCrypto is committed to accurate, unbiased reporting, but market conditions are subject to change without notice. Always conduct your own research and consult with a professional before making any financial decisions. Please note that our Terms and Conditions, Privacy Policy, and Disclaimers have been updated.
Be the first to comment